
Computer Vision · AgriTech IoT · Case study
Eight Orbit Urban Farms
AI Crop Disease Detection & Real-Time Sensor Alerts at 1,500-Acre Scale
CodeSquad built Eight Orbit a two-stage computer vision pipeline and a real-time threshold engine. Together they find crop disease, water stress and nutrient imbalance across 18 pesticide-free fields and alert farm managers before problems spread.
No pesticides means no second chances.
Eight Orbit grows without pesticides, uses 95% less water than conventional farming and reaches up to 6x higher yields. When disease appears, it can’t spray the field. Its tools are isolation, irrigation and nutrition, and they work best while the problem is still small.
At 1,450–1,500 acres across 18 fields, manual scouting couldn’t keep up. By the time early blight or powdery mildew was visible to the eye, it had often already spread to neighboring plants.
The operation was designed to run 1,800–2,100 soil sensors, 22–45 weather sensors and 4–8 aerial crop health sensors. Without automated triage, a sudden moisture drop or a building nitrogen deficit was lost among thousands of normal readings.
Eight Orbit needed two things working together: visual diagnosis that names a disease and maps where it is, and real-time sensor triage that leaves managers with a short list of what to act on now.
Two models: one names the disease, the other maps it.
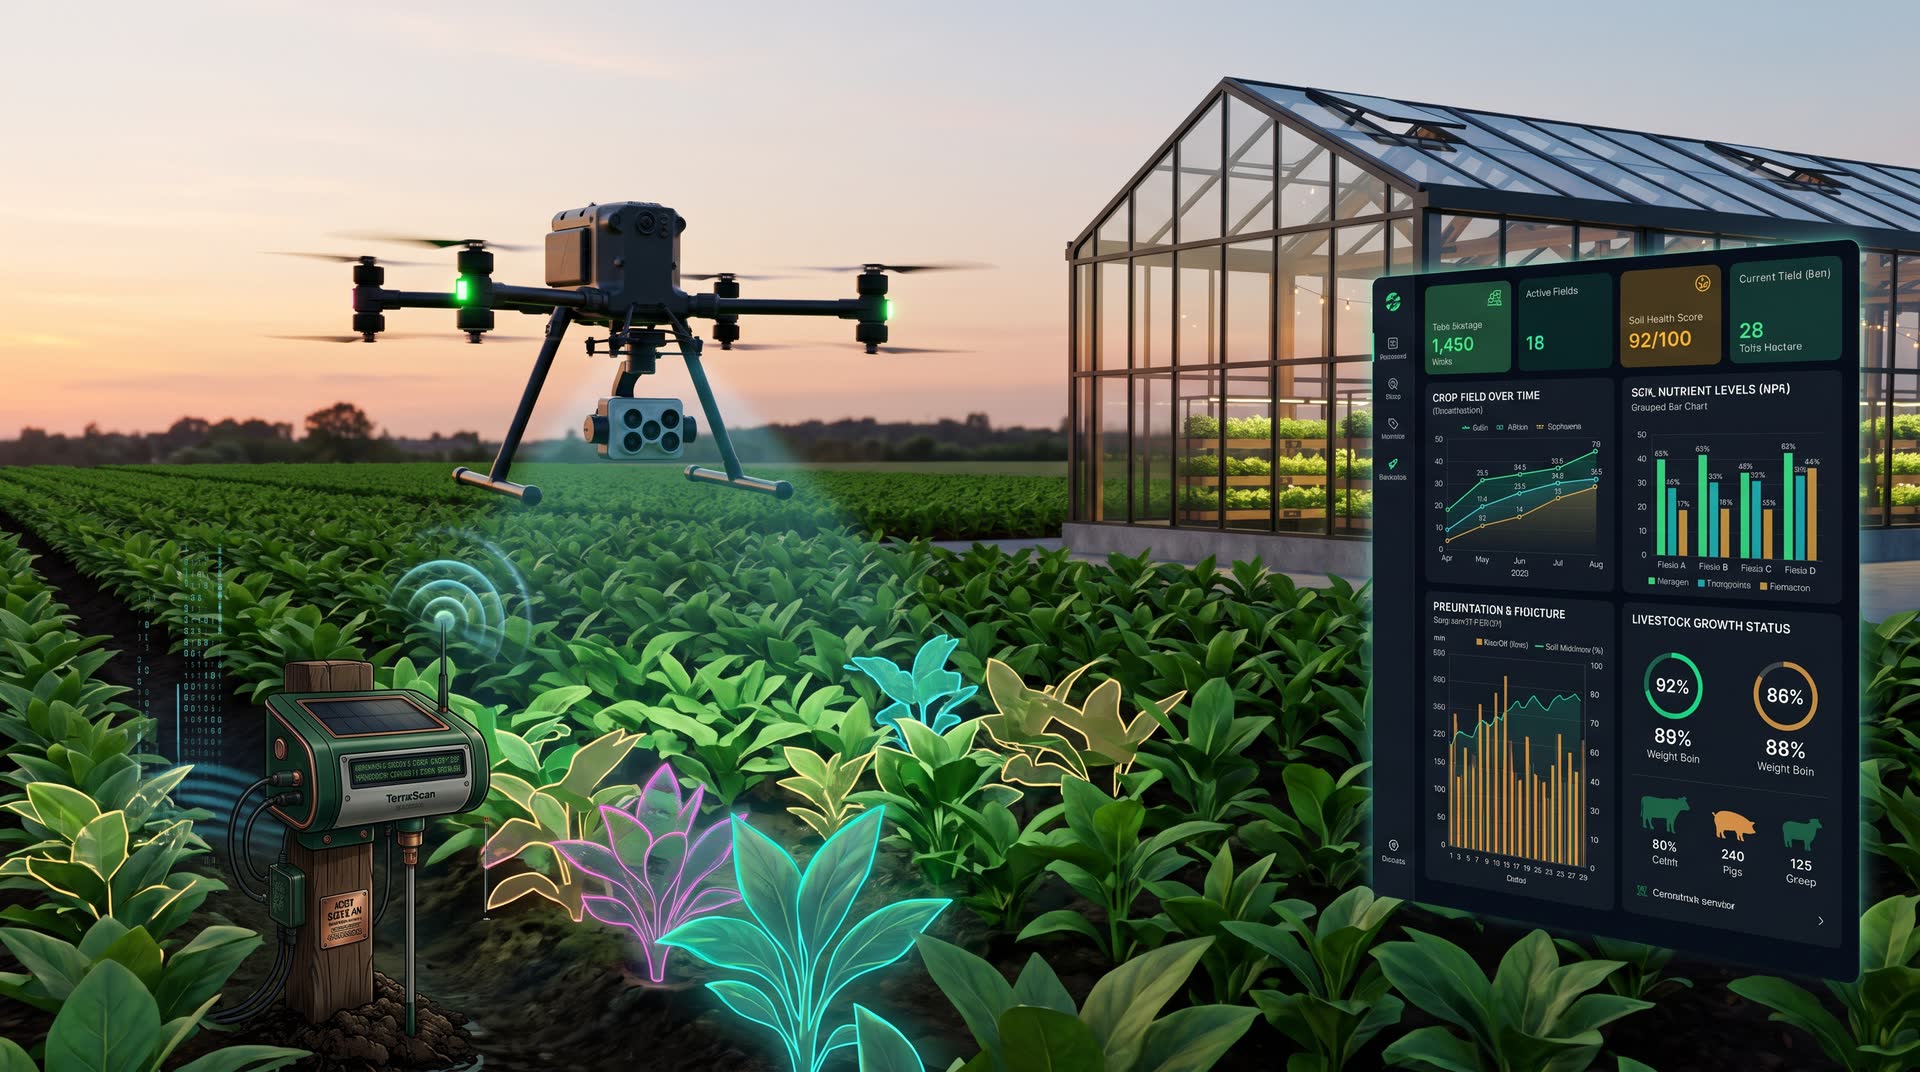
Drone imagery flows S3 → AI → results → portal. A classifier identifies the disease, and a segmentation model draws its exact boundary in the field.
- Capture
Drones carry MicaSense RedEdge multispectral and FLIR Vue TZ20 thermal cameras, alongside standard RGB crop imagery.
- Ingest
Every image and video lands in AWS S3, traceable to its field, flight and capture time.
- Classify
EfficientNetB5 reads high-resolution RGB images and labels specific diseases such as Blight and Powdery Mildew.
- Segment
A UNet with a ResNet backbone processes multispectral and RGB imagery into pixel-level masks of the diseased areas.
- Surface
Labels, confidence scores and masks appear in the portal, and new disease regions go straight to the alert engine.
| Input | Signal |
|---|---|
| MicaSense RedEdge | Red-edge & NIR vigor changes |
| FLIR Vue TZ20 | Canopy temperature / water stress |
| RGB imagery | Lesion & coating patterns |
| Model | Answers |
|---|---|
| EfficientNetB5 | What disease is it? |
| UNet + ResNet | Exactly where is it? |
Thousands of readings, cut down to a few clear actions.
Telemetry flows Field API → time-series → stats, then thresholds → dashboard notifications. Django APIs and async background workers do the evaluation.
- Ingest
Soil and weather sensors from several vendors report through one Field API, normalized into a single schema.
- Aggregate
Readings are stored as time-series and rolled up into PostgreSQL statistics: rolling averages, rates of change and per-field trends.
- Forecast
LightGBM, Random Forest and GBM models forecast soil moisture and rainfall from the sensor and weather history.
- Evaluate
Background workers check live stats, CV disease masks and forecasts against strict agronomy thresholds.
- Alert
When a threshold is crossed, an alert naming the field, the trigger and the data behind it is pushed to the manager’s dashboard.
| Hardware | Measures |
|---|---|
| Decagon EC-5 | Soil moisture |
| Yara N-Tester | NPK nutrients |
| PT1000 | Soil temperature |
| Davis Vantage Pro2 | Weather station |
| Campbell Sci. ARG100 | Rainfall |
| Trigger | Alert |
|---|---|
| Sudden moisture drop | Irrigate (no rain forecast) |
| NPK imbalance | Targeted fertilization |
| Early blight mask | Inspect & isolate |
Built to keep working in the field.
Five milestones, ten sprints, five months.
Each milestone delivered a working, demonstrable piece of the system.
| Milestone | Sprints | Delivered |
|---|---|---|
| M1 · Core System | 1–2 | Django, PostgreSQL, Field API, time-series pipeline, AWS & CI/CD |
| M2 · AI Disease Detection & Forecasting | 3–4 | EfficientNetB5, UNet + ResNet, LightGBM / RF / GBM |
| M3 · Drone Integration | 5–6 | MicaSense & FLIR imagery via S3 into inference |
| M4 · Complete Dashboard | 7–8 | React + TypeScript portal with live alerts |
| M5 · Testing & Pilot Deployment | 9–10 | End-to-end testing, threshold tuning, pilot rollout |
Proactive irrigation. Moisture alerts combined with rainfall forecasts tell managers which fields need water and which incoming rain will cover. Eight Orbit’s water-efficient model depends on that precision.
Targeted fertilization. NPK monitoring flags imbalances field by field, so nutrients go only where the data shows a deficit.
Zero-pesticide containment. Named diseases with pixel-level boundaries let crews isolate early blight and powdery mildew while outbreaks are still small enough to contain without chemicals.
One operational picture. Drone imagery, soil telemetry, weather and forecasts appear on one dashboard, with the system deciding what needs attention first.
Common questions.
Does this only work for agriculture?
No. The same pattern applies anywhere images and sensor data arrive faster than people can review them: classify the defect, segment where it is, then check it against thresholds and alert the right person. That includes manufacturing inspection and infrastructure monitoring.
Can it work with the sensors and cameras we already have?
Yes. The Field API normalizes readings from different vendors into one schema, so new hardware is added as an adapter rather than a rebuild.
Who sets the alert thresholds?
Thresholds are agronomy rules defined with your domain experts and tuned during the pilot. They’re configured and promoted through Dev, Staging and Production like any other change.
How long did it take?
A production-hardened MVP in 5 months, delivered in 10 Agile sprints across 5 milestones.
Images and sensor data piling up faster than your team can review them?